Modelling Bitcoin / Ethereum prices using Metcalfe's / Zipf's law
Bitcoin, and other so-called crytocurrencies have been in the news a lot in the past few months, and has been repeatedly referred to as a bubble somewhat similar to tulip mania or the dot-com tech bubble, even as far back as 2011, when it was worth just $30. Bitcoin enthusiasts claims “it’s not a bubble, it’s an adoption curve”, and quote some metrics based on the total number of users or transactions per day as justification.
As an aside, I think comparing the tulip bubble to any modern day bubble is a bit silly. It is now quite widely believed that the extent of tulip mania was exaggerated. For instance the ridiculously high prices for tulips were actually options call prices that were never executed, and the end of the bubble came about as the virus that made some tulips have stripes went extinct. It’s quite a complex and interesting story, for more info read on here, here, or watch this.
An appealing approach is to treat Bitcoin as a “payment network”, just like we call Facebook a “social network”, and use Metcalfe’s law to estimate its value. This has been done before, although many studies deviate from Metcalfe’s original thesis by using transaction rate in place of the size of the network (see here and here).
In the following I’ll explain a little bit about Metcalfe’s law, as well as a common alternative Zipf’s law, and then attempt to form a model for the price of the two most popular cryptocurrencies (by market cap.). I find it quite appealing that a model with just a single parameter is able to provide a reasonable model for the price of something like Bitcoin. Please don’t use this to decide where to put your money, I did this analysis and blog post just for entertainment purposes.
Metcalfe’s law
Metcalfe’s law is the mathematical realisation of an intuitive idea: the value of a network increases as the number of users in that network increases [1]. The basic idea consists of counting the number of links between nodes in a network as an estimate for the total value of that network. For a network with \(N\) nodes that can each communicate with \(N - 1\) other nodes, this gives a total number of links \(N(N-1).\) If we divide by two to avoid double-counting we can write the total value \(V(N)\) of the network,
The \(\alpha\) parameter is simply empirically chosen, and is essentially the average value each link brings to the network.
Metcalfe’s law was originally used to determine the size at which physical (telephony or ethernet) networks become cost effective. The cost of a network can be written as \(c_R + c_n N\), where \(c_R\) is the cost of the router (or infrastrature cost) and \(c_N\) is the cost of each node. Since the cost of a network increases with \(O(N)\) and the value of that network increases with \(O(N^2)\), larger networks are typically more cost effective. this idea became a huge marketing tool for the early network dotcom companies.
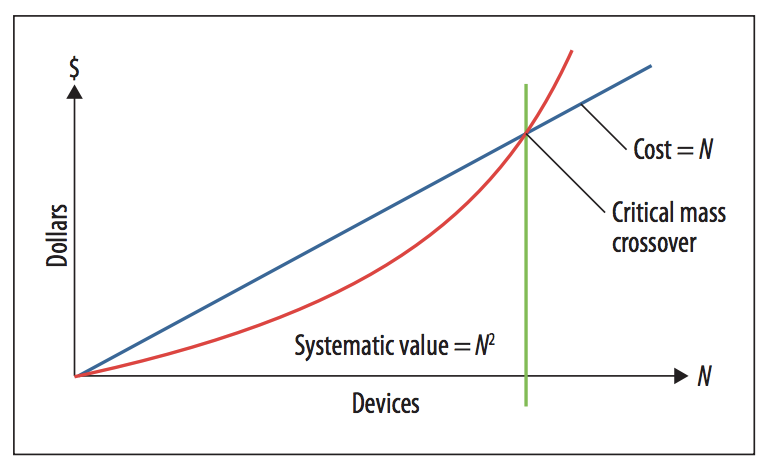 Cross-over of network value and network cost with increasing number of nodes.
Taken from: [metcalfe's law after 40 years of ethernet](http://ieeexplore.ieee.org/document/6636305/).
Cross-over of network value and network cost with increasing number of nodes.
Taken from: [metcalfe's law after 40 years of ethernet](http://ieeexplore.ieee.org/document/6636305/).
Some people argue that there are significant shortcomings with Metcalfe’s law [2], even describing it as “dangerous” and attributing the notorious Dot-dom bubble to peoples’ belief in the endless \(O(N^2)\) growth. Note that the parameter \(\alpha\) is constant for all values of \(N\), which assumes that all links between nodes contribute the same to the network.
Zipf’s law
Zipf’s law is an empirical model for describing unequal resource distribution, first observed in written language by examining the frequency with which words appear in text. the most frequent word appears twice as much as the second most frequent word, and three times as much as the third most common word and so on.
To see how Zipf’s law can be applied to our valuation problem, consider a network where the participants utilise the network at frequencies proportional to their rank in the network: i.e. the \(k^{th}\) user uses the network \(1/k\) times (relative to the other network participants). for large \(N\) the sum of these terms approaches \(N\,log(N)\).
It has recently been suggested that Zipf’s law is superior to Metcalfe’s law for valuing networks because it accounts for the fact not all users contribute equally [2]. Metcalfe wrote an update Metcalfe’s law after 40 years of ethernet (also on YouTube) explaining his justifications for his \(O(N^2)\) law.
Valuing the Bitcoin network with Metcalfe’s law
The Bitcoin (BTC) blockchain is a public ledger that contains information about every bitcoin transaction - we can use this data to assess the size of the network (and a lot more..). one of the charts available on blockchain.info is number of unique addresses used each day, which gives us an indication of the current number of active participants in the network.
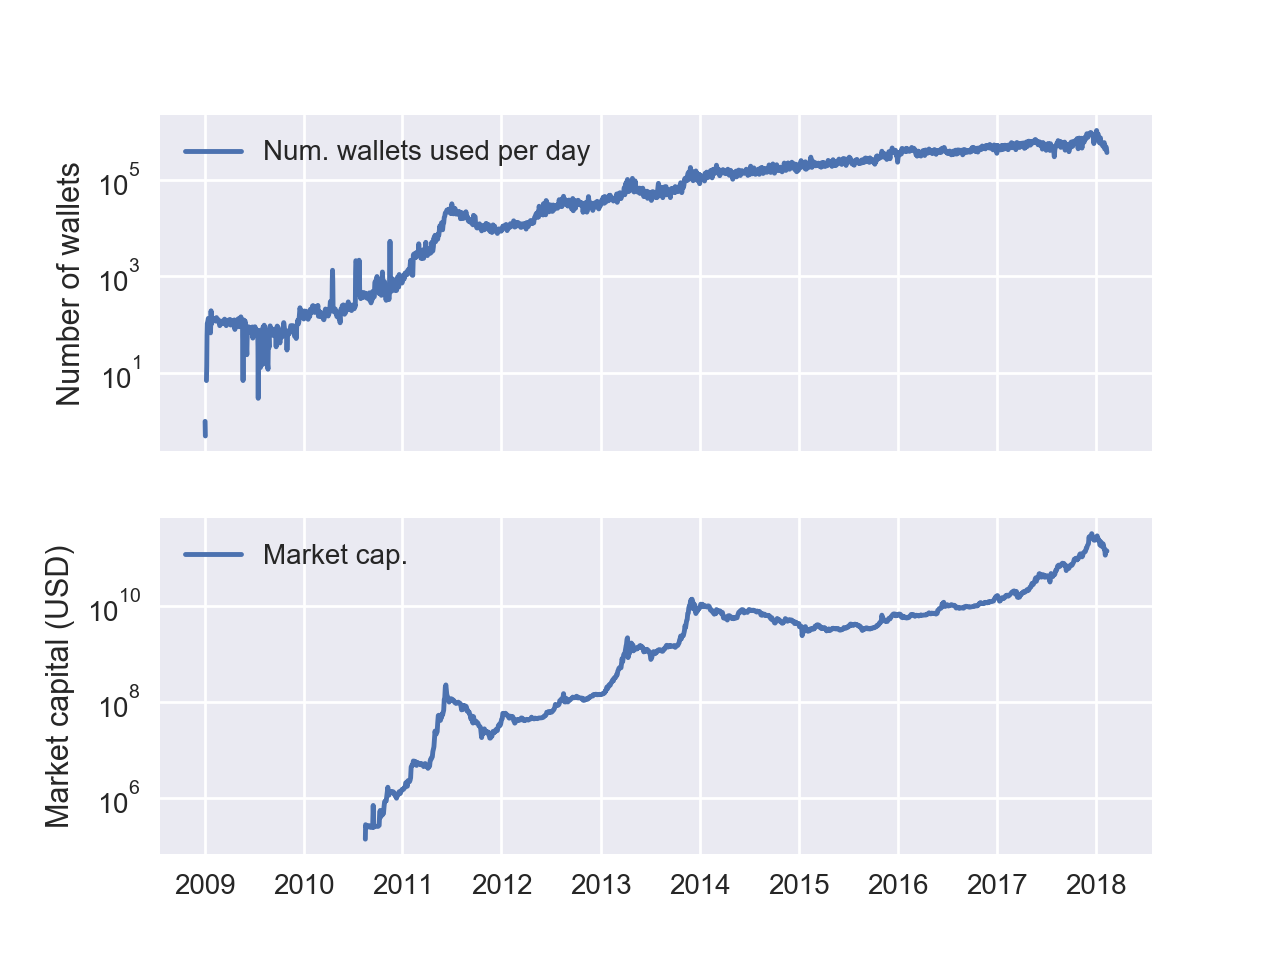 Number of unique BTC addresses used each day, and the total market cap. of BTC.
Raw data downloaded from [blockchain.info](blockchain.info).
Number of unique BTC addresses used each day, and the total market cap. of BTC.
Raw data downloaded from [blockchain.info](blockchain.info).
I used the bayesian pymc3 library to fit the market capital of Bitcoin vs the number of active nodes the equation:
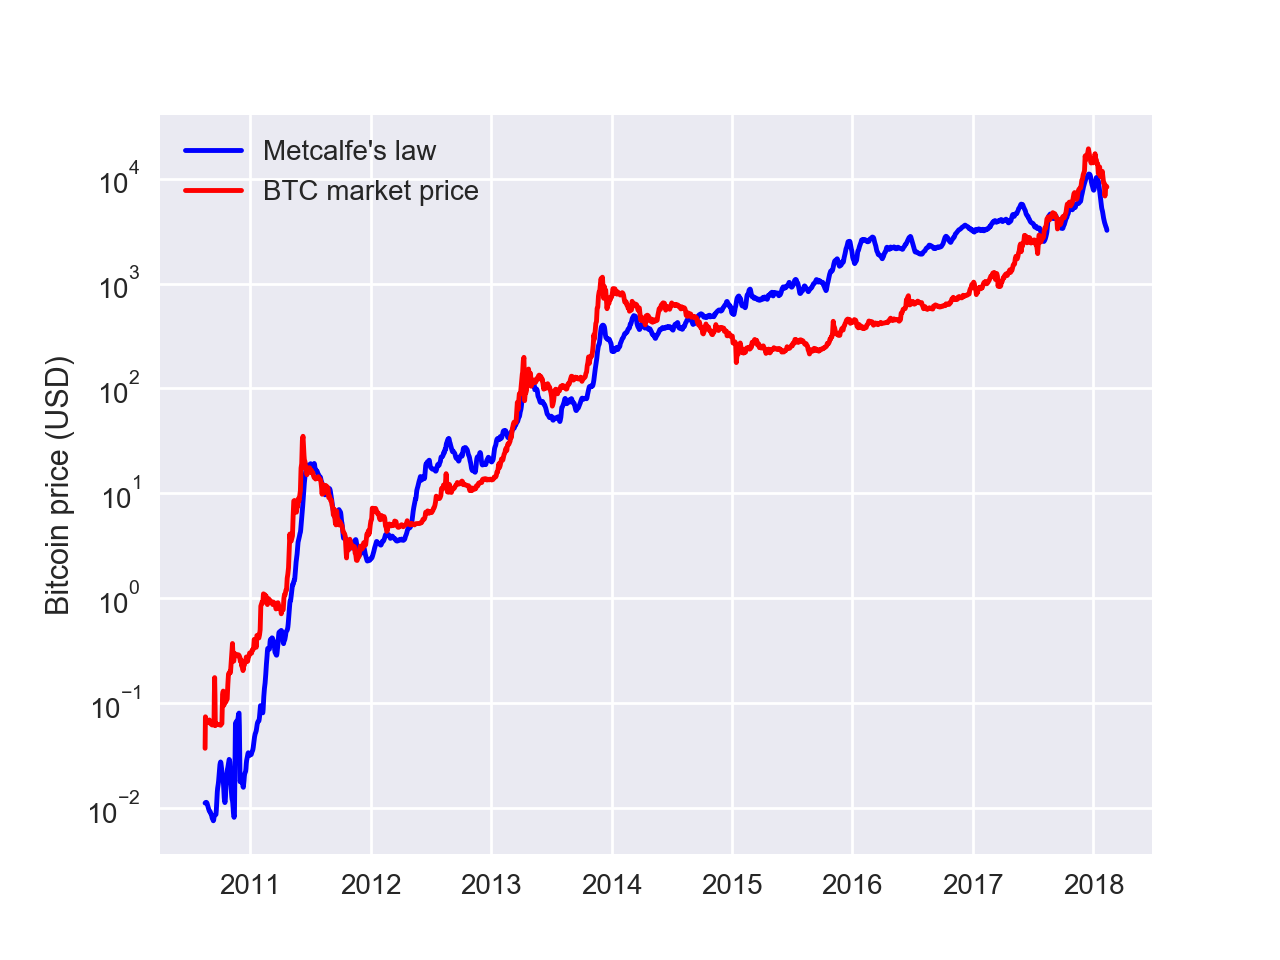 Comparison of Metcalfe's law applied to the number of active users to the market capital for Bitcoin.
By using only active wallets in the above analysis I am able to side-step some of the criticisms of Metcalfe’s law, as I’m only including the users “most valuable” to the network. Note that the definition of an active user here is very strict: we’re only considering users who have send or received BTC in the past 24 hours. this is almost certainly too short a period to be accurate: I would consider myself a pretty active Paypal user althought I only use it 3-4 times a month. Please let me know in the comments if there’s a quick way to extract longer time periods from the blockchain.
Valuing the Ethereum network with Zipf’s law
The second largest “cryptocurrency” by market cap. is Ethereum, and a publicly available source of data for its blockchain is available at www.etherchain.org. the data available is slightly different, for instance with Ethereum it is possible to view the total number of accounts over time. it should be possible to extract the number of active accounts as per Bitcoin, I haven’t found a simple way to do this yet.
Since I’m working with the total number of Ethereum accounts, many of these will be inactive accounts and so it’s reasonable to consider Zipf’s law might work better here. I fit the market capital of Ethereum to the total number of accounts using the equation:
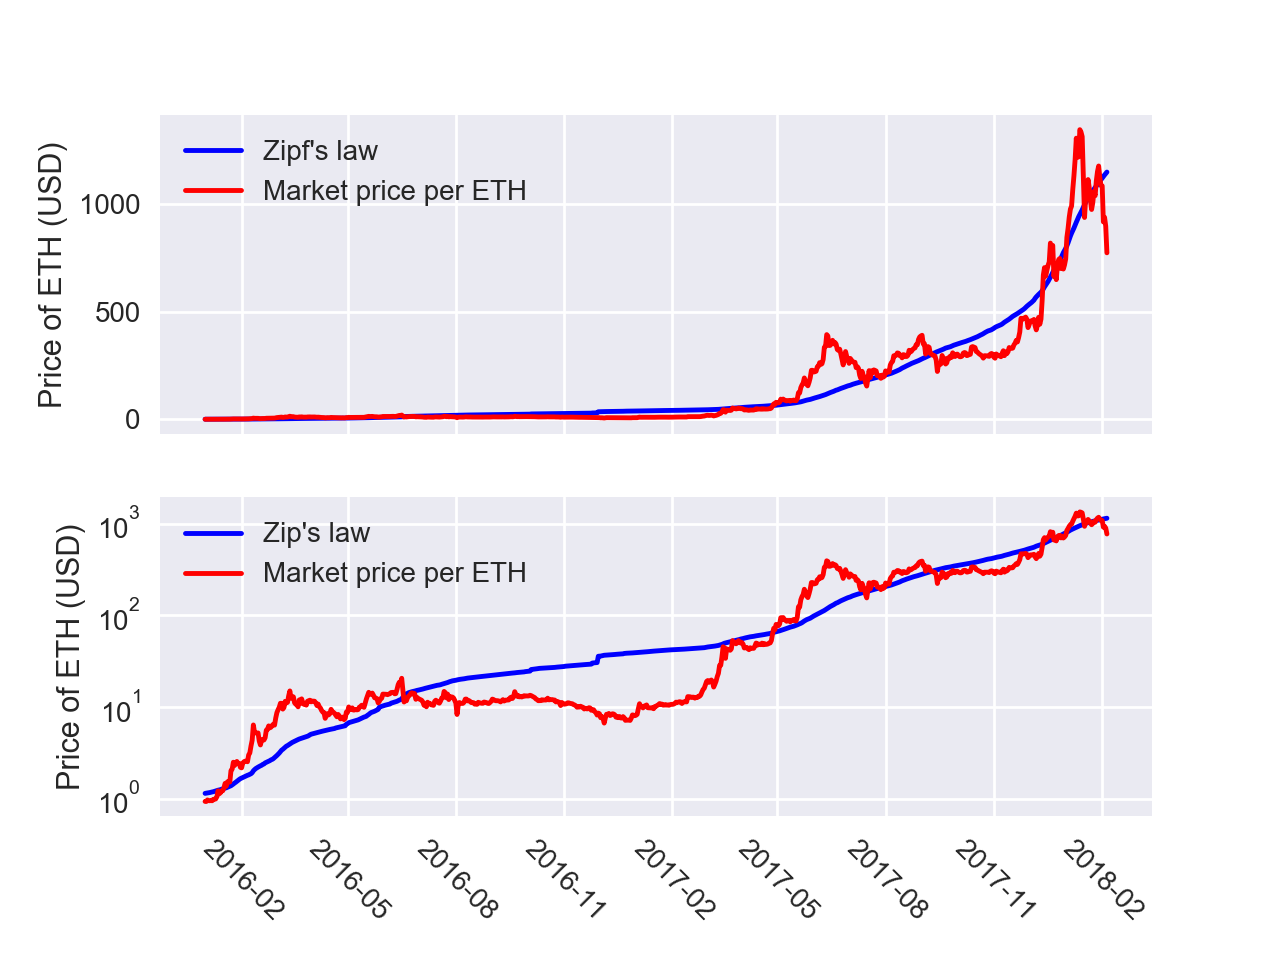 Comparison of Zipf's law applied to the number of total accounts to the market capital for Ethereum.
Both plots show the same data, but the bottom one is plotted on a logarithmic scale.
Comparison of Zipf's law applied to the number of total accounts to the market capital for Ethereum.
Both plots show the same data, but the bottom one is plotted on a logarithmic scale.
Comments
Metcalfe’s law and Zipf’s law can be used to form an approximate number for the value of the Bitcoin and Ethereum networks. I’m not a finance person, and I’ll state now that you probably shouldn’t use the charts above to help your investment decisions: there are assumptions in both methods, and the support for each method is purely empirical.
I only considered the currently active Bitcoin wallets, so hopefully this presents the value of the network for its utility as a means of transferring money from one place or person to another. in my opinion this probably ignores most (if not all) of the speculative value of Bitcoin, which might explain why the current market price is higher than the Metcalfe value. Many Bitcoin acolytes consider it to be the “gold of the crytocurrencies”, a sort of escape from inflationary fiat currencies. whether it fulfills this task or not is yet to be seen, but it’s value as such isn’t included in the Metcalfe expression used here.
Ethereum only came out in 2015, so there’s a lot less data available for it. ETH probably piggybacked on Bitcoin in the sense that people already knew what a cryptocurrency was. With Ethereum we have access to the number of transactions per day (which we showed above, but didn’t use in our analysis). It’s interesting to see that this increases with time, meaning the network is actually being used more as it matures. Note that it’s more challenging to see the total number of real transactions with Bitcoin since it’s common to batch multiple “outputs” (recipients) into a single transaction. see here for example.
Also notice that neither of these methods really “forecast” the future price, they just take the current size of the network and return some number for the current value. Looking at the Bitcoin chart for example, we see that the number of active users dropped significantly in June 2011 and the price decreased with it. Both networks would also be very sensitive to a sudden drop in users.
References
[1]: Metcalfe’s law: A network becomes more valuable as it reaches more users, Infoworld, 1995.
[2]: Odlyzko, A. & B. Tilly (2005) A refutation of Metcalfe’s Law and a better estimate for the value of networks and network interconnections - Link.